


The Dangers of Survivorship Bias

Today at a Glance
What’s a Rich Text element?
The rich text element allows you to create and format headings, paragraphs, blockquotes, images, and video all in one place instead of having to add and format them individually. Just double-click and easily create content.
Static and dynamic content editing
A rich text element can be used with static or dynamic content. For static content, just drop it into any page and begin editing. For dynamic content, add a rich text field to any collection and then connect a rich text element to that field in the settings panel. !
- ml;xsml;xa
- koxsaml;xsml;xsa
- mklxsaml;xsa
How to customize formatting for each rich text
Headings, paragraphs, blockquotes, figures, images, and figure captions can all be styled after a class is added to the rich text element using the "When inside of" nested selector system.
A young statistician saved their lives.
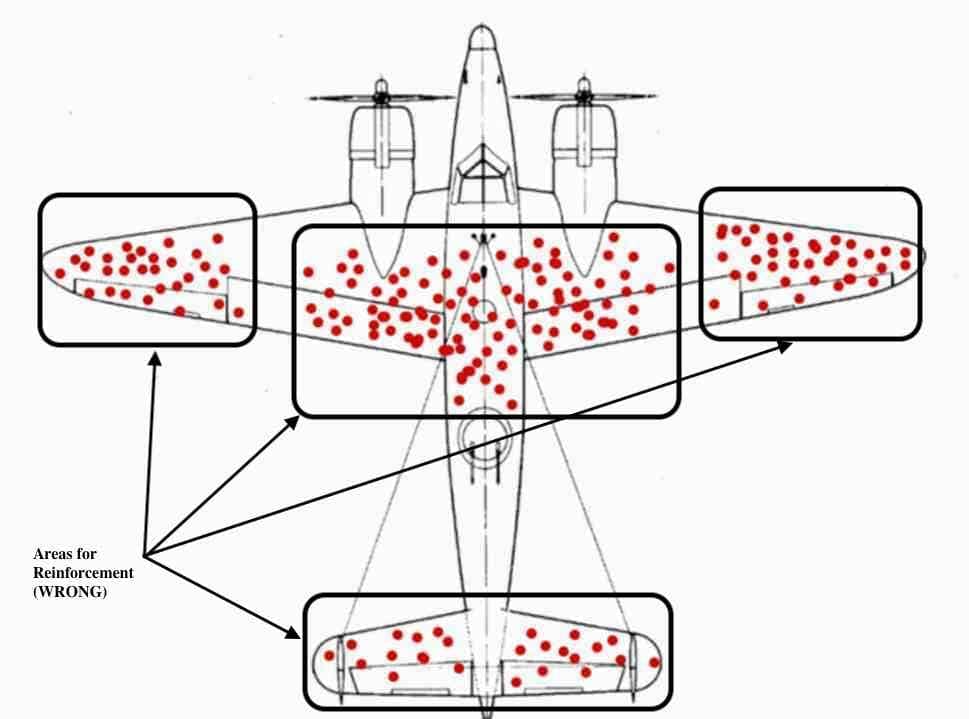
In the early days of World War II, the U.S. military was losing too many of its planes in battle. To stem the tide, analysts started mapping the bullet holes on the returning planes.
Their plan was to add armor to the specific areas of the planes identified by the exercise.
Based on their analysis, they came to the conclusion that reinforcement to the tail, body, and wings would improve their odds of survival.
But a young statistician named Abraham Wald raised his hand with a warning:
They were making a tragic mistake.
Their dataset was flawed, he argued. By only mapping the bullet holes on planes that were damaged and able to return, they were systematically omitting data on a critical, unseen subset:
Planes that were damaged and unable to return.
This was important in considering where to add reinforcement:
- The seen planes had incurred damage that was survivable.
- The unseen planes had incurred damage that was not.
With this simple, yet profound, insight, Abraham Wald reached the contrarian conclusion that reinforcement armor should be added to the unharmed regions of the returning planes.
The unharmed regions were the most vulnerable, he reasoned. This was where the fatal damage was incurred—where bullets caused planes to never make it home.
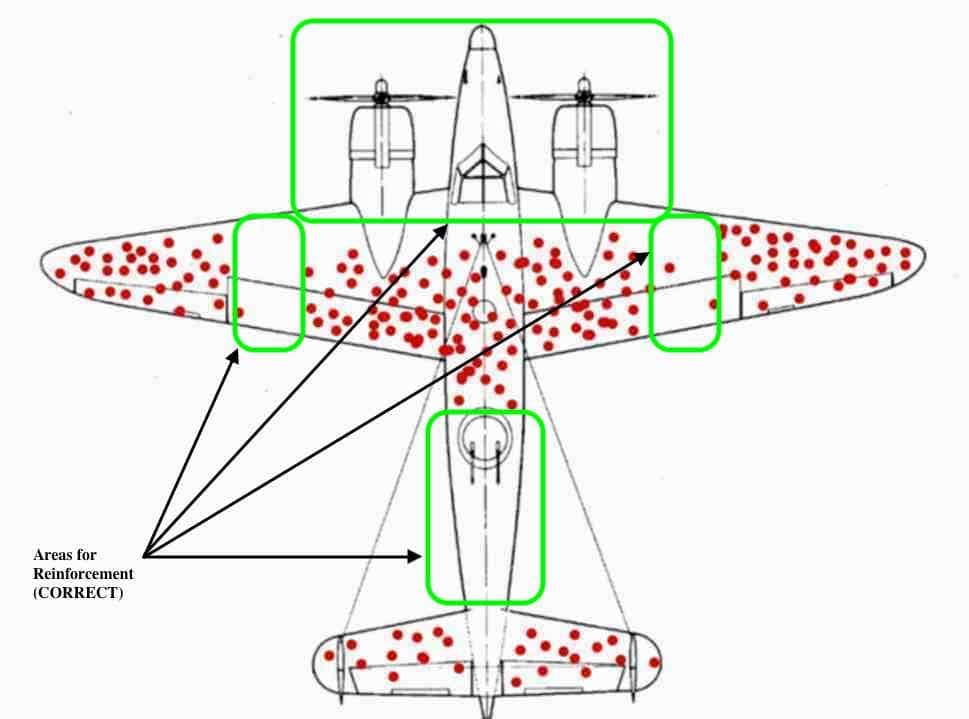
Accepting his conclusion, the military reinforced the engine and other vulnerable parts of its planes, significantly improving the safety of their crews during combat and likely saving thousands of lives.
Abraham Wald had identified a cognitive bias called Survivorship Bias.
And his warning on its dangers extends into every area of your life...
The Perils of Studying Survivors
Survivorship Bias is the error that results from systematically focusing on survivors (successes) and ignoring casualties (failures).
It distorts your understanding of the world by causing you to miss the true base rates of success—the actual probability of success.
You can find examples of Survivorship Bias everywhere you look:
- Books on the common traits of successful people fail to consider all of the unsuccessful people that had those same traits.
- Studies on the cultural strategies of the most successful companies ignore the companies that followed those same strategies and fell apart.
- Applause for the entrepreneur who takes out a second mortgage and wins big fails to consider the long list of entrepreneurs who did the same and lost everything.
- Celebration of the "college dropout" success stories ignores the casualties of the same decision.
When you only draw data from the most easily visible sample (the survivors), you have a biased sample that is not representative of reality.
And if your sample is not an accurate representation of reality, you may talk yourself into a poorly informed decision that leads you into peril.
Fortunately, there is a method to minimize the impact of Survivorship Bias...
The Possibility Grid
To avoid the trap of Survivorship Bias, you need to consider the unseen just as much as the seen.
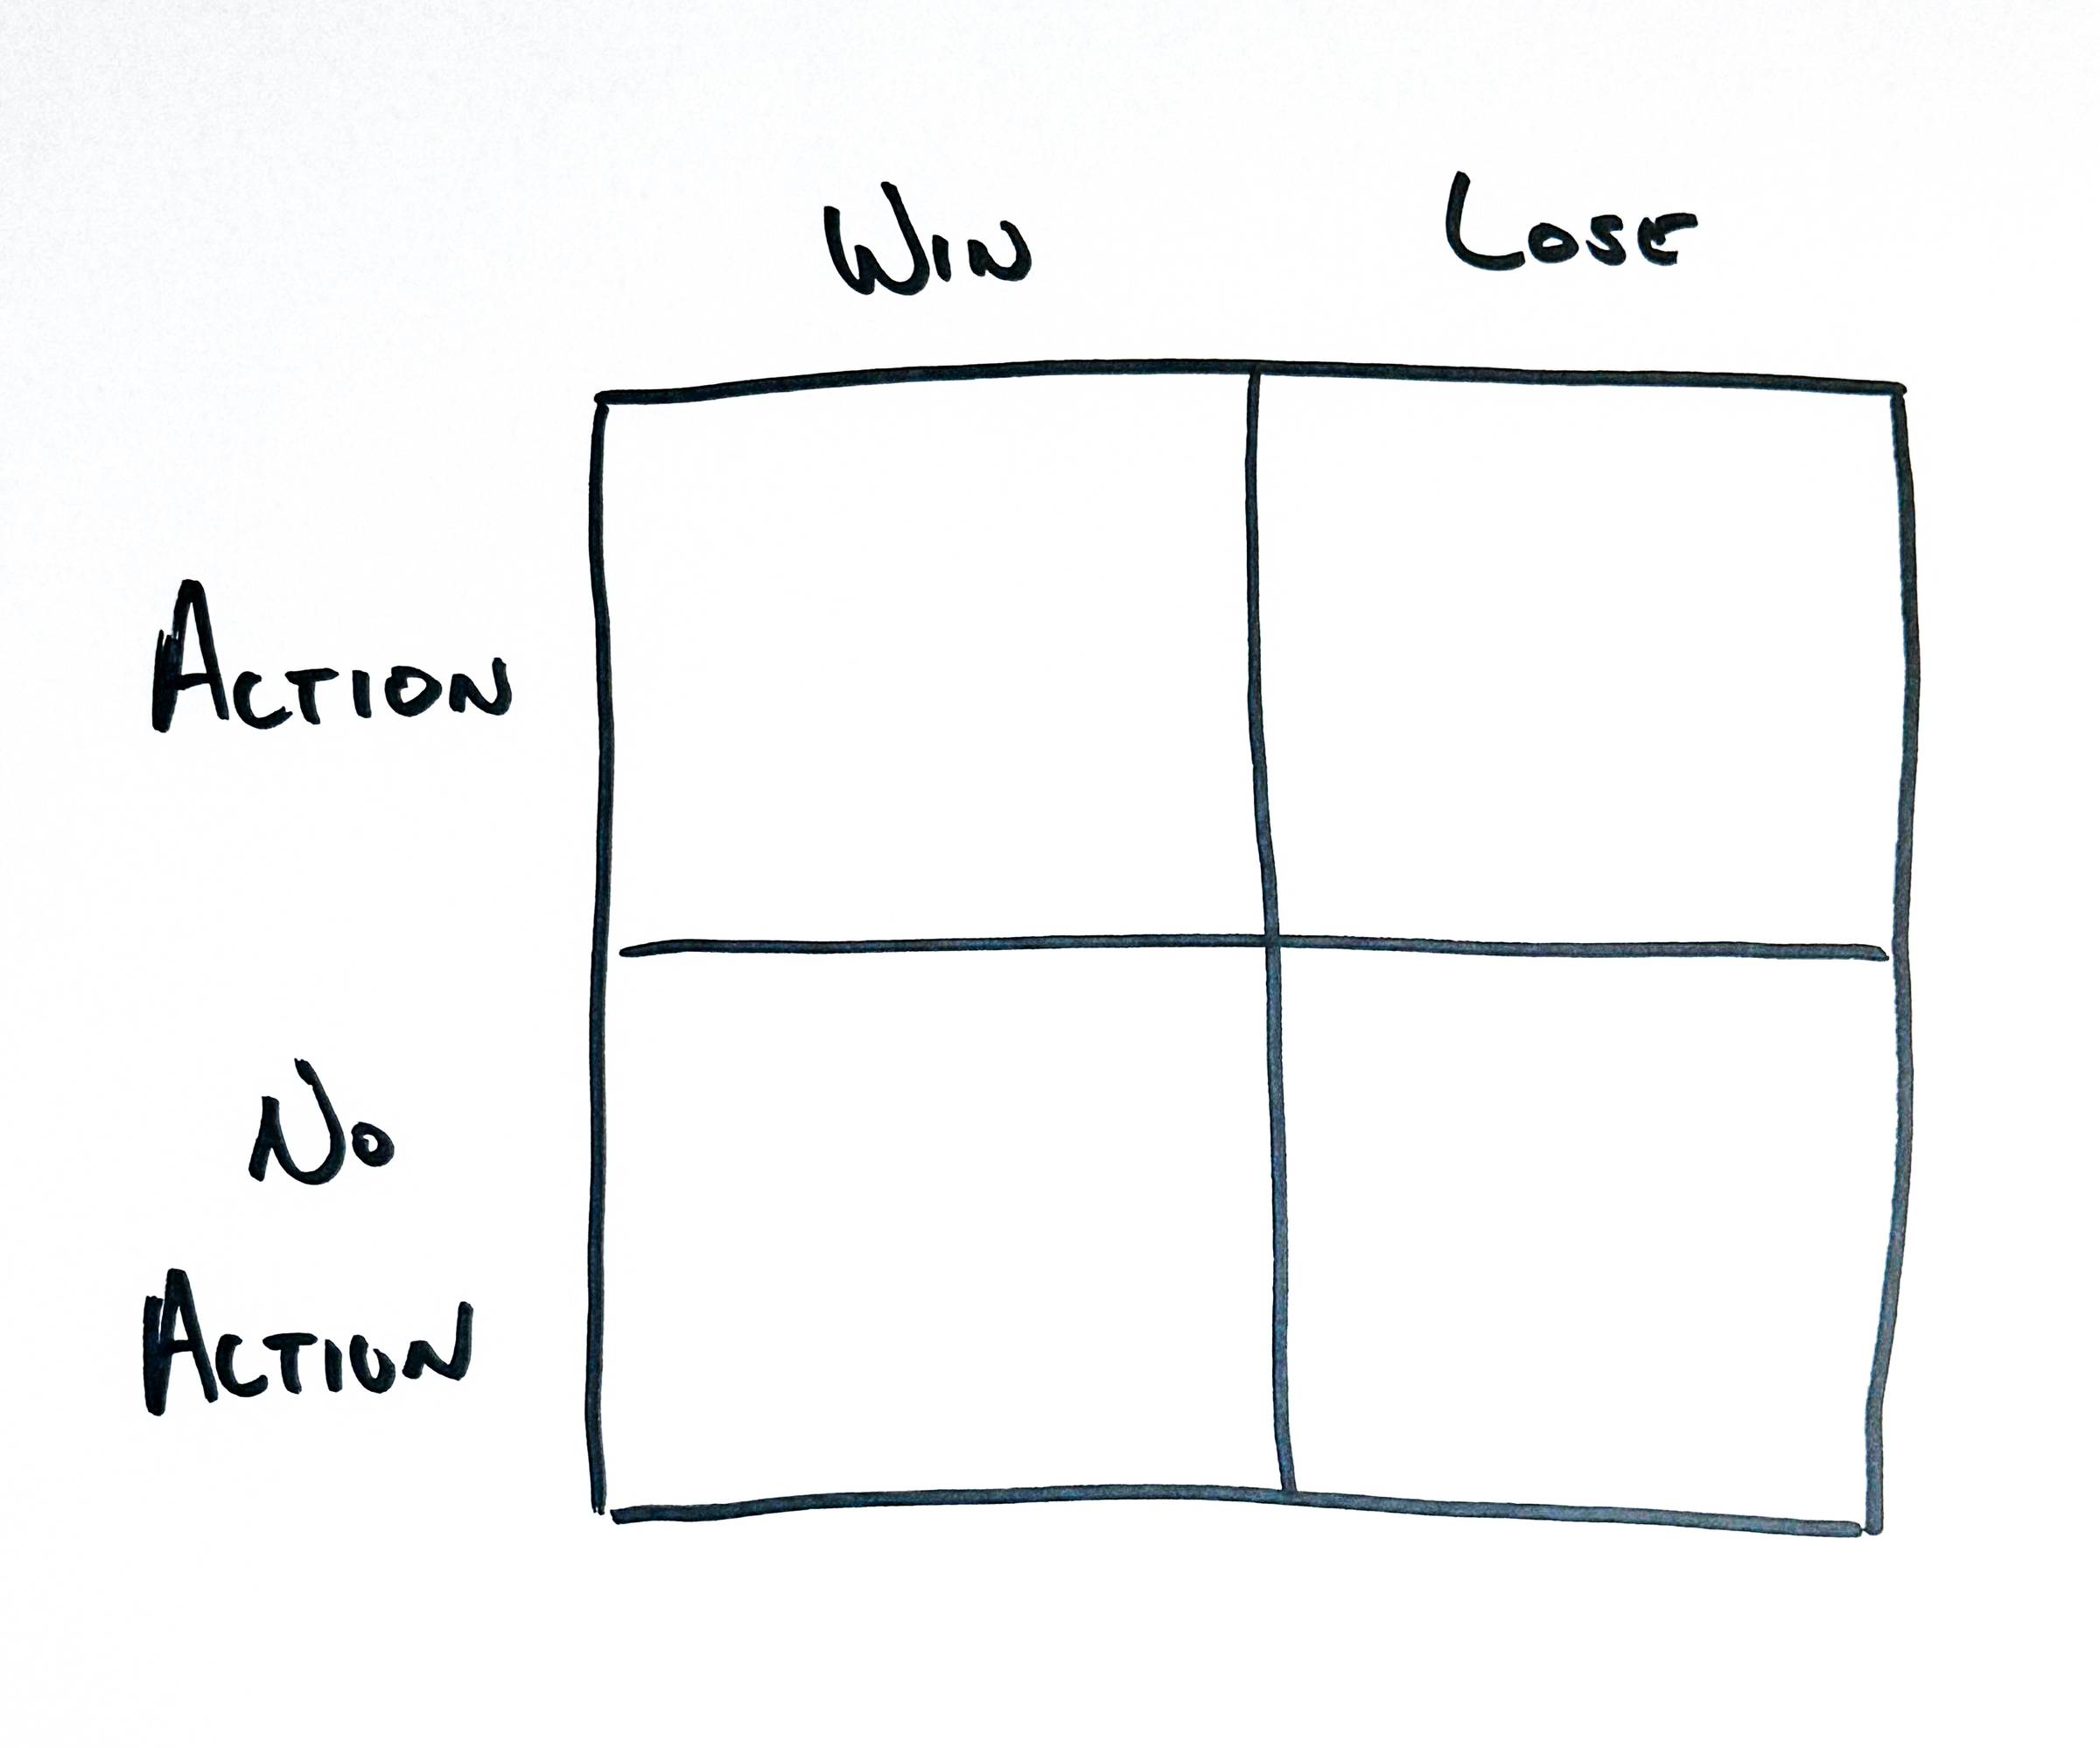
The Possibility Grid is a visual tool to help you do that.
It's a 2x2 matrix with the action on the rows and the outcome on the columns:
- Top-Left: Action, Win
- Top-Right: Action, Lose
- Bottom-Left: No Action, Win
- Bottom-Right: No Action, Lose
The "Action" is whatever step you're evaluating the merits of. Dropping out of college, taking on a second mortgage, mirroring a set of cultural strategies at your company, etc.
The "Outcome" is what happened. Win or lose. Survivor or casualty.
The Top-Left (Action, Win) is typically the easily seen data. It's what we read books about. It's what we celebrate. Staring at this quadrant and ignoring the others is how Survivorship Bias thrives.
The goal is to fill out the other three quadrants with information and data to form a more balanced, accurate representation of reality.
Let's look at a simple example:
Evaluating the decision to drop out of college to start a company.
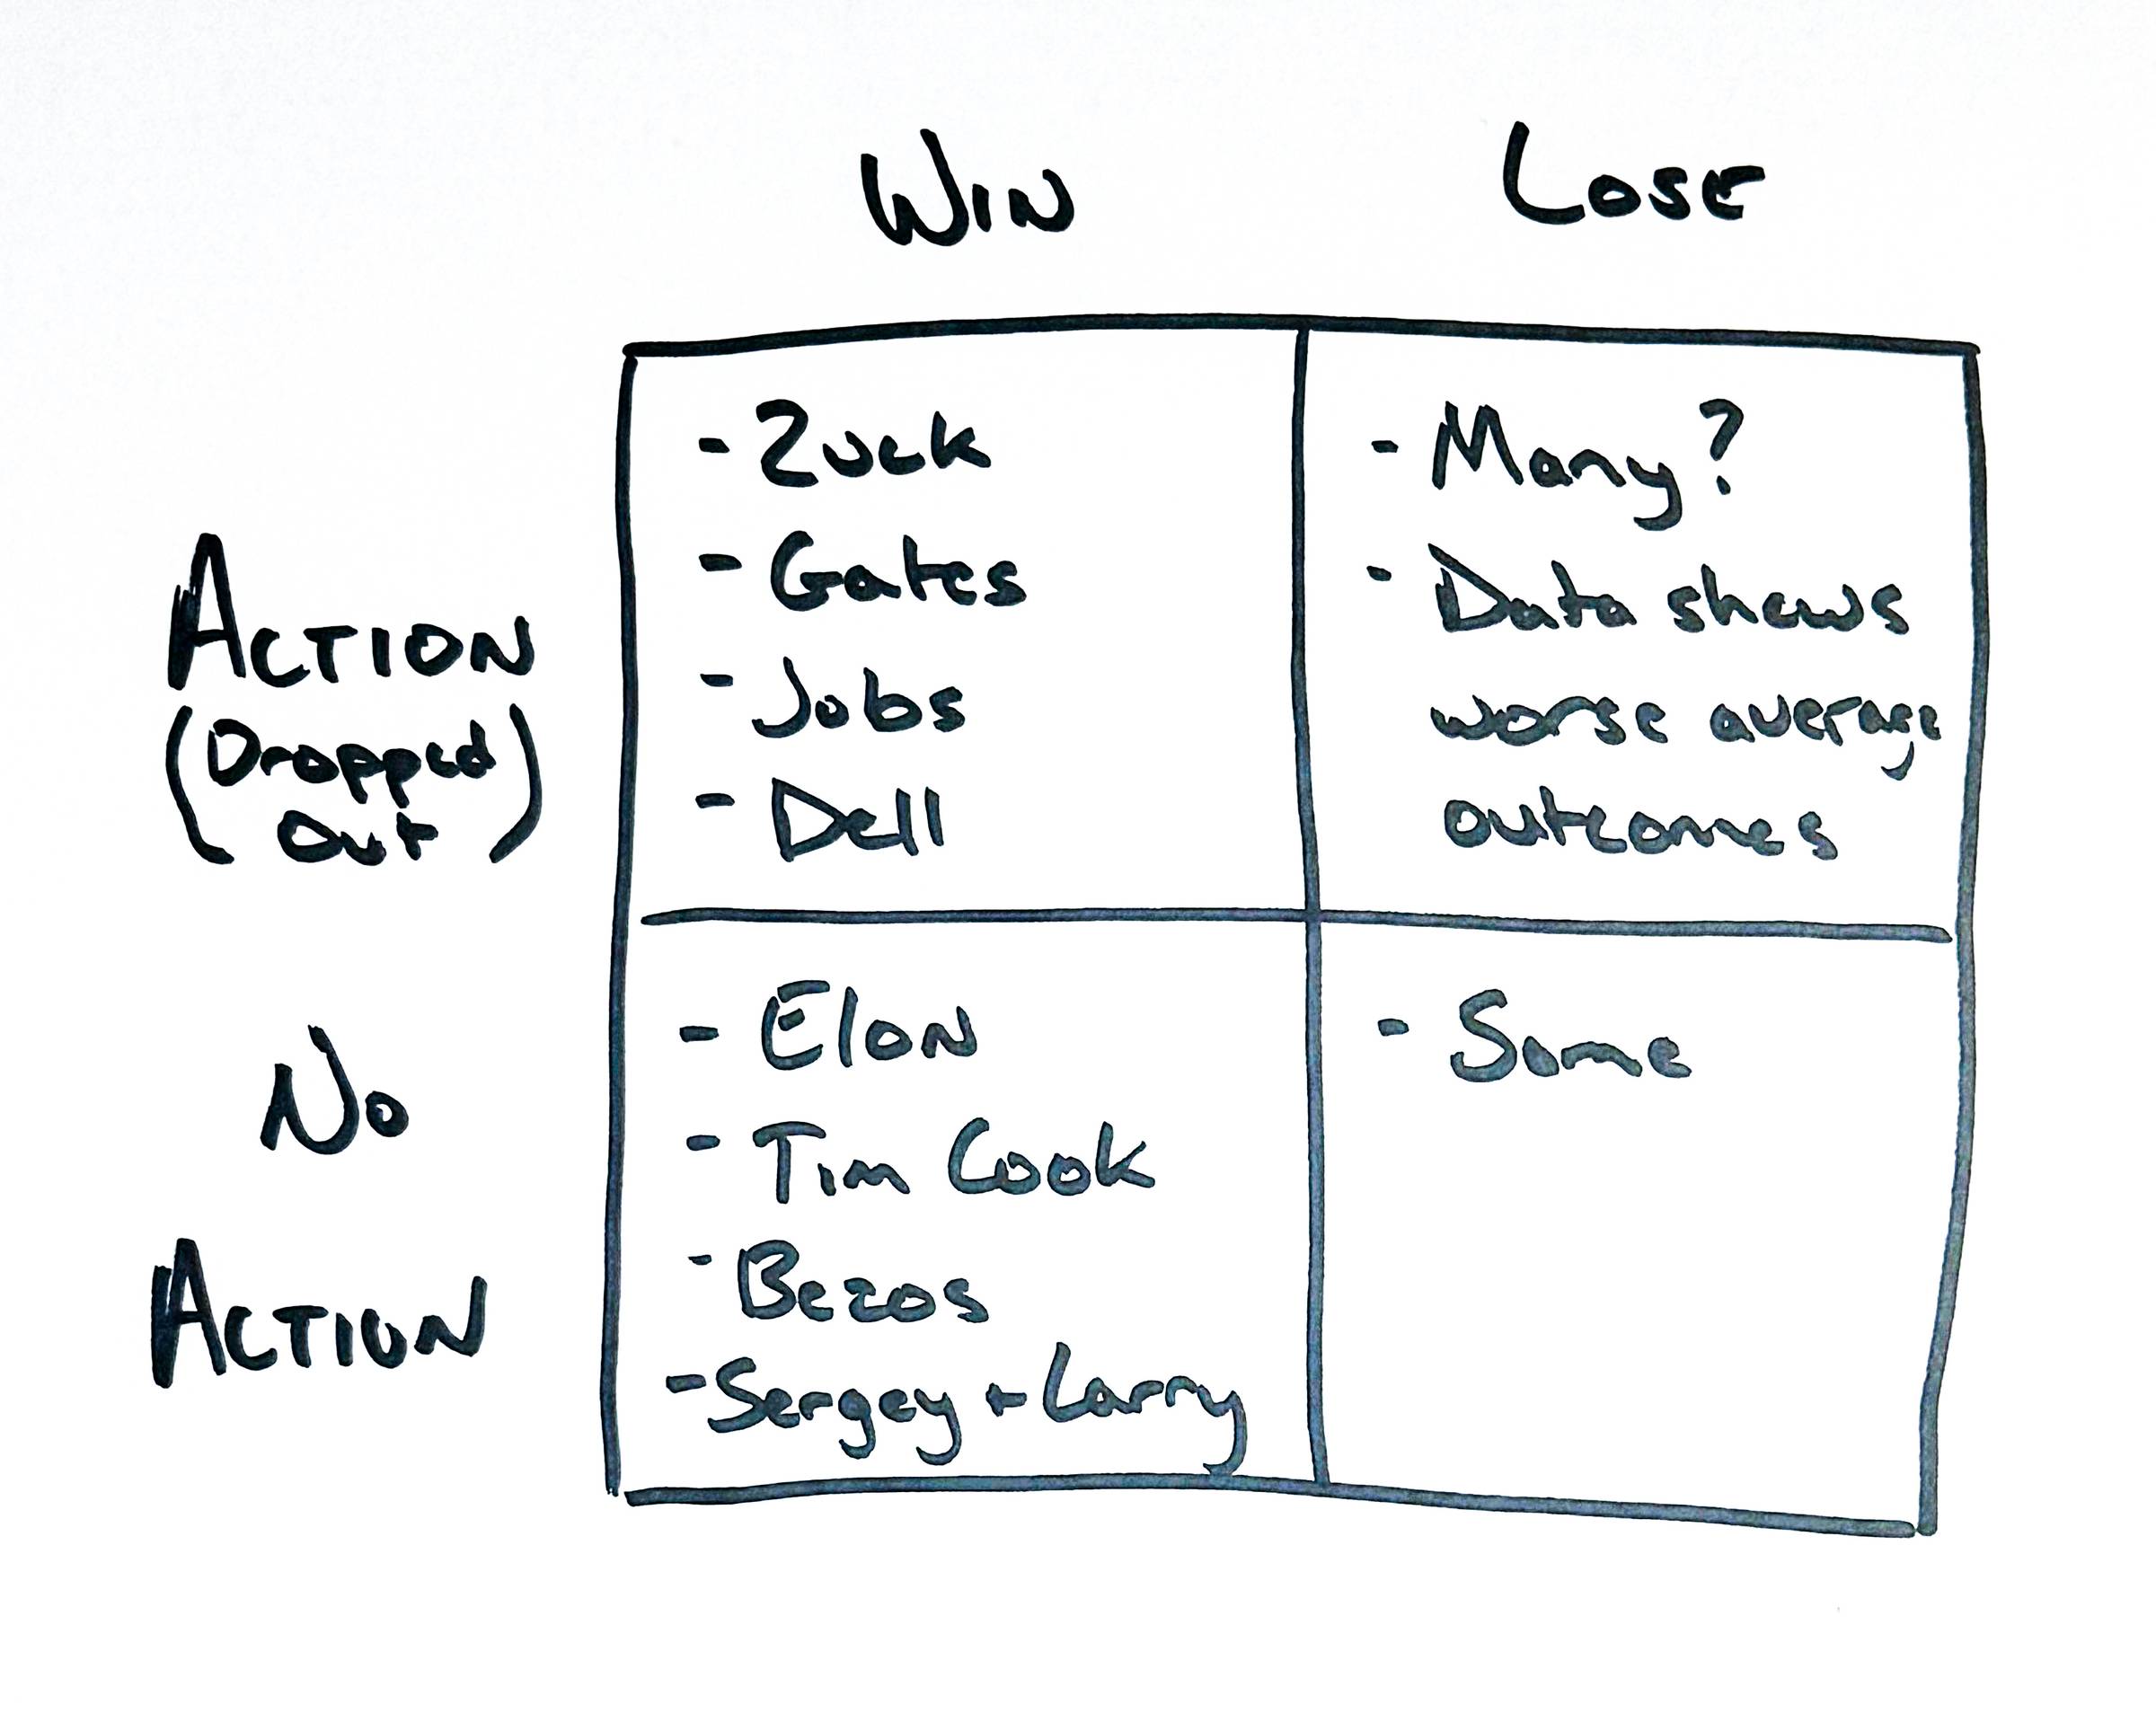
It's very easy to only consider the seen evidence in this example. The list of famous entrepreneurs who dropped out to start their company is an impressive one, including Mark Zuckerberg, Bill Gates, Steve Jobs, and Michael Dell.
But focusing exclusively on these survivors misses a lot of unseen evidence.
- No Action, Win: Those who got their college degree and succeeded on an extraordinary level. This list includes Elon Musk, Tim Cook, Jeff Bezos, Sergey Brin, and Larry Page.
- Action, Lose: Those who dropped out and failed. While hard to find specific names, there are many such cases, and the data on the earnings impact of college degrees is positive.
- No Action, Lose: Those who got their college degree and failed. Certainly some examples out there, though the overall data shows this is less likely.
Where the surface level analysis may lead you into an obvious decision to drop out, a more thorough analysis of the unseen evidence will force a balanced perspective.
The Possibility Grid doesn't answer the question or weigh the merits for your specific situation, but it does ground you in a more accurate representation of reality as you make the decision for yourself.
So, the next time you face an important decision that may be impacted by Survivorship Bias, sketch out a simple Possibility Grid and use it to form a more balanced perspective.
But Where Are Those Painted Who Drowned?
Over 2,000 years ago, the Roman philosopher, Cicero, told the story of Diagoras, a vocal atheist who often spoke about his non-belief in the gods.
Those trying to convince Diagoras of the legitimacy of a higher power showed him a series of painted tablets portraying a group of sailors in a shipwreck.
Specifically, he was told that it showed men who had prayed during a vicious storm and then survived the shipwreck.
Diagoras looked at the paintings and replied:
"I see those who were saved, but where are those painted who prayed and drowned?"
The most dangerous data point is the one you never see.
The unseen is just as important as the seen.


